How to Evaluate Business Value: A Practical Valuation Guide
How to evaluate business value step by step: normalize your financials, choose DCF or multiples, run worked examples and adjust for risk.
You've got a buyer asking what your business is worth, a spreadsheet showing healthy profit, and a number in your head that reflects years of work. Then someone asks whether you've accounted for your replacement salary, customer concentration, or the cash tied up in inventory. Suddenly, the answer feels less certain.
Learning how to evaluate business value means separating what you can prove from what you hope will happen. Start with defensible earnings, choose methods that fit the business, and expose the assumptions that change the result. A useful valuation isn't a precise-looking number. It's a range you can explain under pressure.
Table of Contents
- How to Normalize Your Financials in Seven Steps
- Pick the Valuation Method Your Situation Supports
- Build a Discounted Cash Flow Model With Worked Numbers
- Cross-Check the DCF With Multiples and Deal Prices
- Adjust for Risk and Hard-to-Model Value
- Avoid the Pitfalls That Distort Valuations
- Confirm the Range Before You Negotiate
How to Normalize Your Financials in Seven Steps
Normalization means restating financial performance so a buyer can see what the business earns under ordinary operating conditions. It isn't an exercise in maximizing add-backs. Every adjustment must survive the question: would a new owner still need to pay this cost?
Build an earnings base a buyer can reproduce
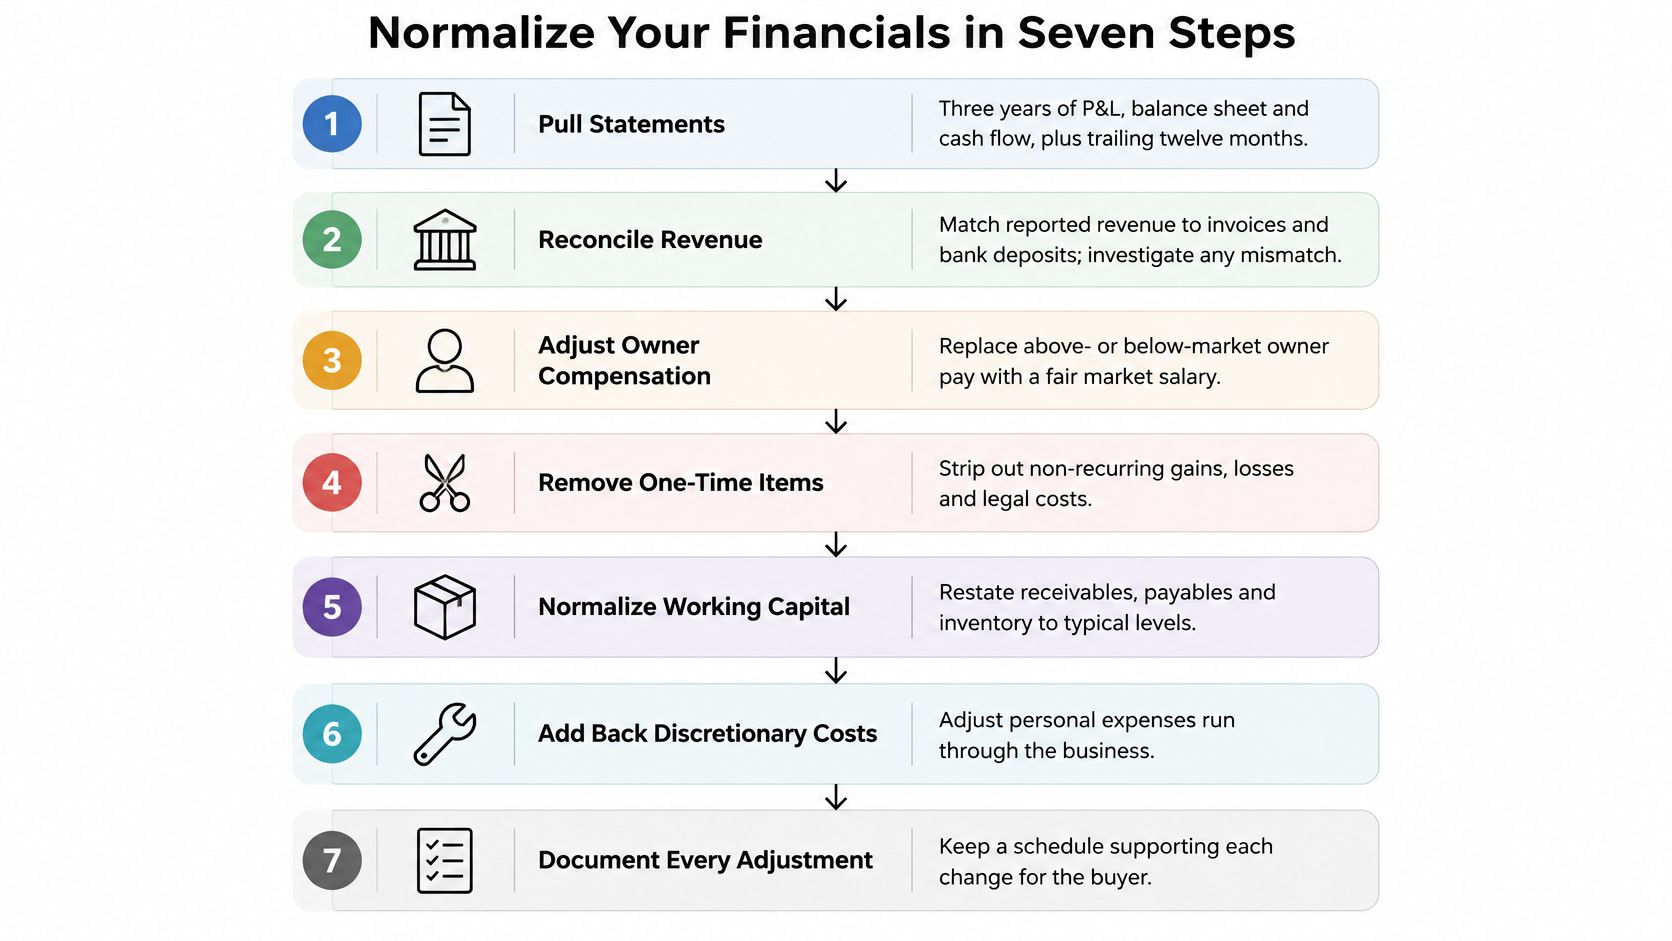
Pull the complete financial record. Gather three years of profit-and-loss statements, balance sheets, and cash-flow statements, plus trailing twelve-month results. Keep monthly detail alongside annual totals so seasonal peaks don't look like sustainable growth.
Reconcile reported revenue. Match the ledger to invoices, payment-processor settlements, and bank deposits, allowing for receivables, refunds, tax, and settlement timing. Don't treat every difference as missing revenue, but don't leave unexplained differences for the buyer to discover.
Remove one-off items. Separate legal settlements, unusual grants, and gains from asset sales from recurring operations, documenting both favorable and unfavorable adjustments. Contractor fees aren't exceptional because you hired a different contractor each year.
Replace owner pay with market compensation. Add back compensation above a realistic replacement salary and deduct any shortfall when the owner works below market pay. Include the responsibilities being replaced, because a founder handling sales and operations may require more than a nominal management allowance.
Correct revenue timing. If customers pay annually in advance, recognize revenue over the service period rather than treating the whole receipt as current-period earnings. Keep deferred revenue visible, since a buyer may inherit delivery obligations without receiving the corresponding cash.
Calculate normalized EBITDA and free cash flow. Build separate lines for earnings before interest, taxes, depreciation, and amortization, and for cash remaining after operating taxes, capital expenditure, and working-capital investment. Remove documented personal expenses, but retain maintenance spending and realistic receivables, inventory, and payable requirements.
Maintain an adjustment log. Record the original account, adjustment, rationale, supporting document, and effect on earnings and cash flow. Finish with a single normalized base-year figure you can defend line by line, not a collection of optimistic alternatives.
Use this flowchart as a working checklist, with the adjustment schedule providing the detail behind each step.
Keep earnings separate from sale proceeds
A business can report attractive EBITDA while consuming cash through overdue receivables or equipment replacement. Keep those effects visible rather than forcing earnings and cash flow to tell the same story.
For an industry-specific companion, Bizbe, Inc.’s valuation walkthrough for logistics sellers provides context for approaching a sale valuation. Use sector guidance to sharpen your questions, not to justify adjustments your own records can't support.
Practical rule: If removing an expense would prevent the buyer from maintaining current revenue, it probably isn't an add-back.
Pick the Valuation Method Your Situation Supports
No single valuation method is right for every business. Choose the method your evidence supports, then use a different method to challenge it. A detailed model built on weak forecasts isn't more credible than a straightforward comparison with similar businesses.
Valuation methods compared by fit and inputs
| Method | Best when | Core inputs | Output |
|---|---|---|---|
| Discounted cash flow (DCF) | Stable or forecastable cash flows and at least three years of history | Five-year forecast, discount rate, terminal growth rate | Present value of future cash flows |
| Market multiples | Comparable public or private companies are visible | EBITDA, revenue or ARR, peer multiples | Value implied by peer multiples |
| Precedent transactions | Recent acquisitions exist in your sector | Deal prices and deal multiples | Control value that includes a buyer premium |
| Asset-based | Asset-heavy business or winding down | Fair-value balance sheet, liabilities | Net asset value as a floor |
The time periods in the DCF row are a practical modeling setup, not an eligibility test. A young company can be modeled, but limited operating history makes its forecast harder to substantiate.
Match the method to the decision
DCF suits a business whose managers can explain how customers, pricing, costs, and reinvestment produce future cash. It becomes fragile when the forecast relies on an untested product launch or assumes profitability without funding the work required to achieve it.
Market multiples are useful when peers are observable, but comparability requires more than an industry label. A founder-dependent services firm shouldn't inherit the multiple of a diversified company with recurring contracts and professional management.
Precedent transactions are particularly relevant to a sale of control. Check whether the price includes strategic synergies, contingent payments, or unusually favorable financing before applying it to your business.
Asset-based valuation is useful when equipment, property, or realizable inventory drives recoverable value. Its apparent floor still needs deductions for disposal costs, obsolete stock, and liabilities that won't disappear on closure.
For another practical explanation of the choices, The Owner's Shortlist valuation walkthrough can help you organize the method-selection discussion before commissioning a formal report.
I would pair a forward-looking method with a market method. As a working review trigger, investigate a gap of more than about 20% before presenting a conclusion. That's a diagnostic rule, not a universal valuation standard, and a missing or unsuitable comparison is better disclosed than manufactured.
Build a Discounted Cash Flow Model With Worked Numbers
Free cash flow of $400,000, $550,000, $700,000, $850,000, and $950,000 over five years looks like a business getting stronger. Discount those year-end receipts at an illustrative 8% and their present value is $2,668,918. Nothing in the operations changed. Only the required return did.
Australia's Office of Impact Analysis cost-benefit guidance defines NPV as PV of benefits minus PV of costs and tests public-policy appraisals across a range of real discount rates. Borrow the definition and the habit of testing a range. Do not value a private business at a public-policy discount rate.
Build the forecast from operating evidence
Each of those five amounts has to come from an operating schedule.
Revenue enters only when customer counts, renewals, pricing, and new sales tie back to contracts, cohort records, and pipeline conversion. I score those non-financial inputs against an evidence threshold before they touch cash: a measured cohort renewal can support the forecast, and an unsigned pipeline name cannot. Gross margin needs the delivery costs behind it. EBITDA margin needs a staffing and overhead plan that is funded. Capital expenditure covers replacement equipment and the investment growth requires. Working capital follows when customers pay, when suppliers must be paid, and how much inventory operations hold.
For enterprise value, discount free cash flow available to all capital providers at a matching weighted average cost of capital. Build the equity component from a risk-free base plus market, size, and company-specific premiums you can justify. Equity cash flow and an enterprise discount rate do not belong in the same calculation.
Change one assumption and watch the result
Use PV = cash flow ÷ (1 + discount rate)^year, with receipts at year-end. Hold every cash-flow assumption still.
Five-year present value at three discount rates
| Discount rate | Present value (USD) | Change vs. 8% base |
|---|---|---|
| 3% | $3,122,064 | +17.0% |
| 8% (base) | $2,668,918 | 0.0% |
| 10% | $2,514,538 | −5.8% |
The 8% row is this example's base, picked so the swing is visible. It is not a prescribed rate for a private company. A drop from 8% to 3% raises present value by 17.0%. A rise to 10% cuts it by 5.8%. Same customers. Same margins.
Rebuild the arithmetic in Excel or Google Sheets:
| Year | Free cash flow | Discount factor | Present value |
|---|---|---|---|
| Forecast year | Operating forecast | 1/(1+rate)^year |
Cash flow × discount factor |
Add continuing value without hiding its influence
For a business that continues, terminal value equals final-year cash flow × (1 + perpetual growth) ÷ (discount rate − perpetual growth). Discount that amount back to today.
At the 8% base, perpetual growth of 2% to 3% produces a total continuing-business value of about $13.66 million to $15.99 million. Most of that total is cash beyond the explicit forecast. The final-year margin and the reinvestment required to keep it have to clear the same evidence bar as the five forecast years, or the terminal number is a hope with a formula attached.
The $2.67 million figure is only the explicit-period present value. It is also the whole answer if the business has a finite life and no later proceeds. It is not the full going-concern DCF.
Subtract the acquisition price or initial investment when the question is investment NPV. Keep real cash flows with real rates, and nominal cash flows with nominal rates. Rerun the model and record which single change moves the number most: the discount rate, terminal growth, or the operating forecast.
Cross-Check the DCF With Multiples and Deal Prices
Suppose a hypothetical business has $1.2 million of normalized EBITDA, and suitable peers support an illustrative 6 to 8 times range. Multiplication gives an enterprise value of $7.2 million to $9.6 million. The arithmetic is easy; defending the peers is the difficult work.
Select companies with similar revenue models, customer types, geography, margins, growth, and management depth. A smaller, slower-growing business with concentrated customers would generally belong toward the lower end of that hypothetical range, rather than receiving the midpoint automatically.
Compare the economics beneath the multiple
For a subscription software company, an annual recurring revenue multiple can be useful when current profit understates deliberate investment. But recurring revenue isn't equally valuable across companies. Strong growth supported by durable net revenue retention gives a buyer a different outlook from growth that depends on replacing departing customers.
Customer economics help explain the difference. A comparative study published in American Impact Review reported median projected 36-month CLV of $218 for organic-dominant brands, $189 for balanced brands, and $141 for paid-dominant brands, with median CLV:CAC ratios of 4.2x, 3.4x, and 2.1x, respectively.
Those are study-group results, not valuation multiples or forecasts for your business. Their practical relevance is the question they prompt: how much customer contribution remains after acquisition spending?
- Define CAC consistently: Divide acquisition-related marketing spending by customers acquired in the matching measurement period.
- Model contribution, not sales alone: Include purchase frequency, order value, gross margin, and retention over a stated CLV horizon.
- Inspect cohort quality: Separate customers acquired through repeatable channels from customers attracted by temporary discounts.
Reconcile enterprise value, control, and continuing operations
Label acquisition comparisons as control transactions, and identify any buyer-specific premium. Don't assume the entire purchase price represents a transferable control premium, since synergies and deal terms can explain part of it.
Also bridge enterprise value to equity value by accounting for debt, excess cash, and agreed working-capital adjustments. Otherwise, a seller may mistake the operating-business value for cash proceeds at completion.
The illustrative market range sits well above the $2.67 million explicit-period DCF. That first gap is largely a scope problem: one calculation includes continuing operations through a market multiple, while the other excludes terminal value. The full going-concern DCF then needs its own reconciliation against the market range and the net asset floor.
Don't average incompatible values. First make sure they describe the same business, ownership interest, cash-flow period, and balance-sheet treatment.
Adjust for Risk and Hard-to-Model Value
A buyer needs to know what remains if the largest customer leaves, the founder steps away, or an important licence can't transfer. Model those events directly before adding a general risk premium.
Keep the financial statements and the underlying operating evidence open together.

Risk and non-financial factors and how they move value
| Factor | What to check | How it moves value |
|---|---|---|
| Customer concentration | Share of revenue from the largest client | A client above about 20% is a practical stress-test trigger, not an automatic valuation haircut |
| Revenue durability | Growth by cohort and pipeline coverage | Supports higher terminal growth only when growth repeats across cohorts |
| Intellectual property | Patents, trademarks, owned code, assignable licences | Premium requires documented ownership; unassigned IP can lower value |
| Key-person dependence | Who closes deals and runs delivery | Lowers value until processes and second-line leaders are documented |
| Contract quality | Term length, renewal rates, termination rights | Multi-year contracts with renewal evidence support greater certainty |
| Option value | Capabilities, data assets, new revenue paths | Counts only with a named time horizon and evidence threshold |
For concentration, model lost contribution after avoidable costs, not merely lost revenue. Then inspect cohort performance before increasing long-term growth expectations. Verify IP assignments, test whether someone else can run sales and delivery, and read termination clauses rather than relying on headline contract length.
Score future possibilities without calling them cash
Deloitte's analysis of digital investment value identifies distinct perspectives including investment ROI, enterprise value and latent potential, KPI returns, and new monetization streams. That distinction supports separating realized value from option value, rather than folding every capability improvement into current profit.
Use a scored input with evidence gates:
- Financial: Award confirmed status only when incremental contribution or avoided expenditure is reconciled to records.
- Operational: Treat capacity gains as provisional until measured adoption and quality show that released time can be redeployed.
- Strategic: Recognize an option only with a named owner, decision date, customer evidence, and remaining investment requirement.
- Risk: Reduce confidence when ownership, compliance, execution, or reversibility remains unresolved.
Score each component as unsupported, demonstrated, or repeatable. Unsupported claims receive no monetary premium; demonstrated claims enter an upside scenario; repeatable outcomes may enter the base forecast if the cash-flow connection is documented.
For an additional valuation perspective, consider this video alongside your own evidence schedule.
Show the unadjusted range beside the risk-adjusted range, with each change tied to a scenario. Don't penalize the same customer-loss risk in cash flow, the discount rate, and the multiple unless each adjustment captures a different exposure.
Avoid the Pitfalls That Distort Valuations
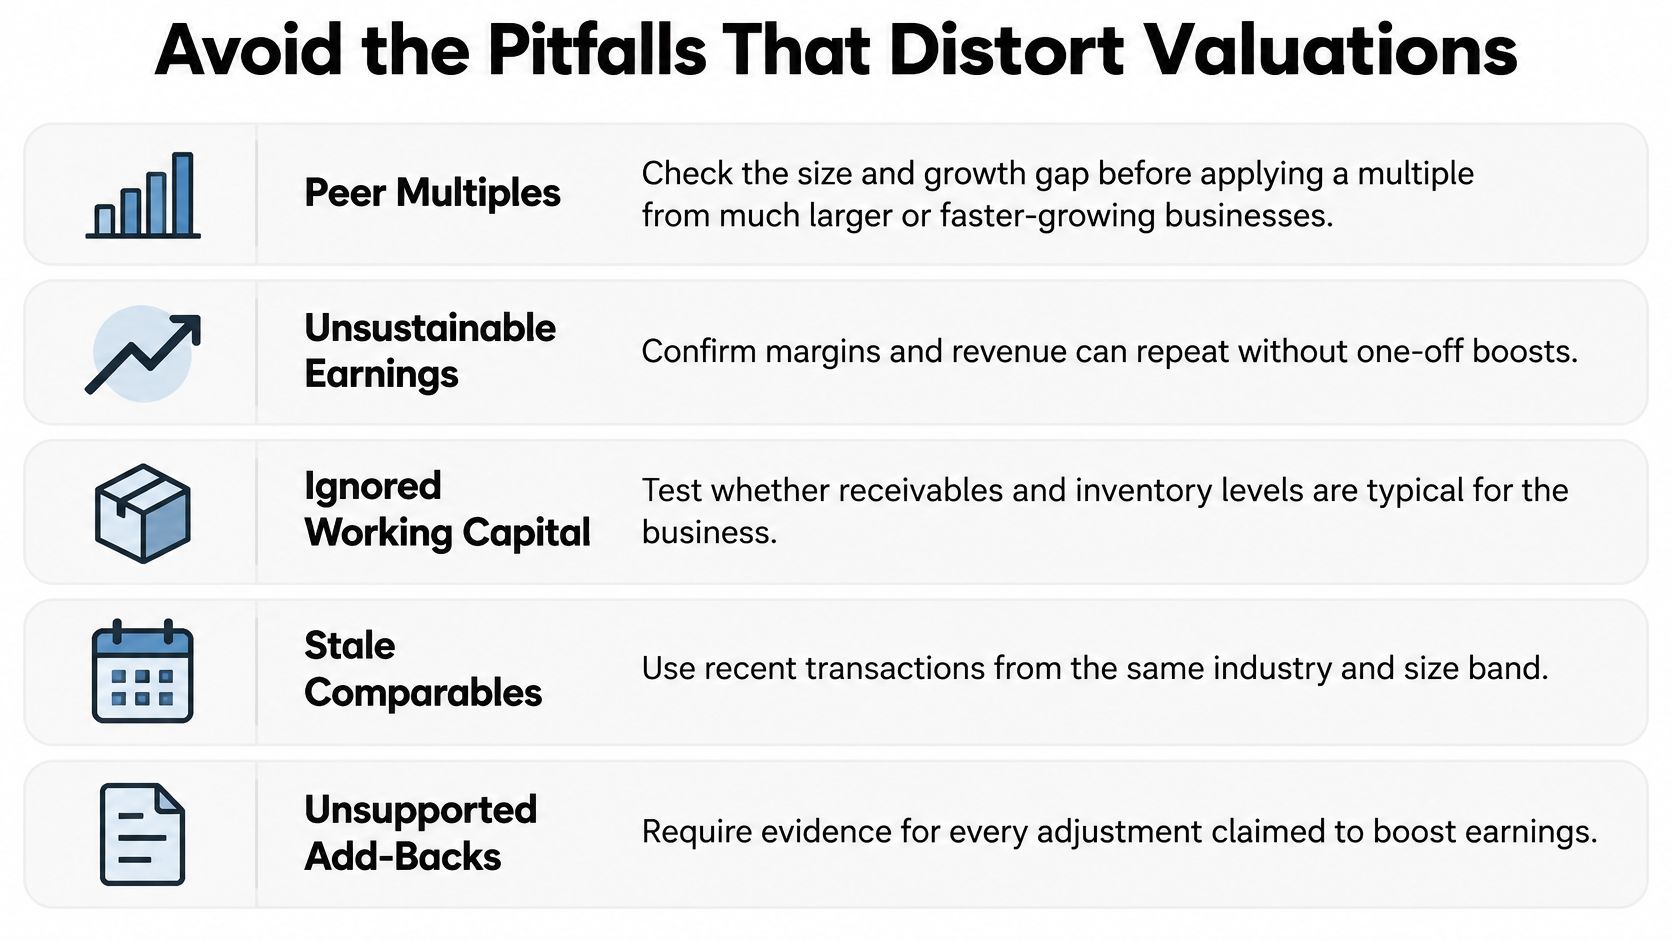
The most expensive mistake is applying a convincing multiple to earnings the buyer can't reproduce. A polished spreadsheet won't rescue unsupported add-backs, mismatched metrics, or revenue that hasn't been earned.
Run these checks before accepting the output:
- Peer mismatch: Compare size, growth, margins, and customer concentration before borrowing a larger company's multiple.
- Metric mismatch: Apply revenue multiples to revenue and EBITDA multiples to consistently defined EBITDA.
- Unrealized revenue: Keep invoiced, earned revenue distinct from signed backlog and unsigned pipeline. Forecast future opportunities separately rather than describing them as realized.
- Uniform risk: Test uncertain cash flows with scenario-specific assumptions or an appropriately justified required return.
- Missing cash requirements: Include receivables, inventory, payables, and sustainable maintenance spending.
Keep this checklist beside the model during review.
Don't confuse activity with economic value
BCG's analysis of the AI value gap reports that only 17% of stagnating organizations rigorously track AI value, compared with more than 60% of future-built firms. That comparison supports measurement discipline, not a claim that tracking alone causes superior performance.
For indirect benefits, require a baseline, a credible control or counterfactual, and an accountable owner. Track adoption alongside quality, customer impact, turnaround time, and risk.
Hours saved aren't automatically payroll savings. They become financial value when you can demonstrate avoided hiring, additional contribution from redeployed capacity, or an actual expenditure reduction, without transferring the work to another team.
Confirm the Range Before You Negotiate
A defensible valuation gives the buyer a clear explanation of the range, not just a midpoint to dispute. Present comparable outputs side by side, state what each includes, and weight them according to evidence quality rather than personal preference.
Hong Kong Exchanges and Clearing's valuation guidance calls for explaining why the selected method is appropriate and disclosing principal DCF assumptions, including revenue growth, margins, major expenses, and planned capital expenditure. Follow that discipline even when you aren't preparing a regulated valuation report.
Make the central case conditional on reconciliation
| Measure | Illustrative conclusion | Required qualification |
|---|---|---|
| Explicit-period DCF | About $2.67 million | Excludes continuing value |
| Market multiples | $7.2 million to $9.6 million | Requires defensible peers and consistent enterprise-value treatment |
| Asset floor | Supported net realizable asset value | Requires asset appraisals, liabilities, and disposal costs |
A hypothetical 60/40 weighting of $2.67 million and the $8.4 million market midpoint produces approximately $4.96 million. That is valid arithmetic, but it becomes a credible central case only if the lower DCF is justified as a comparable full-business value, for example through a documented finite-life scenario. It isn't valid to blend the explicit-period subtotal with a going-concern market value merely to split the difference.
If continuing operations are expected, complete and reconcile the terminal-value model before weighting methods.
Put the assumptions where the buyer can inspect them
Build downside, central, and upside cases from explicit operating conditions. The downside should show credible customer losses, margin pressure, or delayed collections; the upside should require evidence rather than enthusiasm.
Your assumption schedule should include:
- Revenue growth: Contracts, cohort behavior, pricing evidence, and pipeline conversion.
- Gross and EBITDA margins: Delivery economics, staffing requirements, and supplier terms.
- Capital expenditure: Maintenance needs and funded expansion plans.
- Discount rate: Capital-provider requirements and company-specific risk justification.
- Terminal growth: Sustainable demand and the reinvestment needed to support it.
Add a sensitivity line showing the largest single-driver movement. Before negotiating, confirm that adjustments are logged, peers are named, debt and cash are reconciled, and the range survives the stress case.
The downside case sets the negotiating floor, not the midpoint. For a seller, use it alongside the value of continuing to own the business; for a buyer, use it to test the maximum price you can safely support.
Set your walk-away decision before the first serious offer, and schedule a model review in three months. Change the range when the evidence changes, not because negotiations become uncomfortable.
The SEO Agent automates keyword research, source-checked drafting, internal linking, and CMS publishing, with per-article performance tracking. If organic growth is part of your value-creation plan, visit The SEO Agent and evaluate a controlled rollout against qualified leads, contribution margin, and verified time savings rather than publishing volume alone.